The Auroral Oval: Read a Magnetic Pattern on a Geographic Map
An aurora map is easier to interpret when you stop treating its colored oval as a circle around the geographic North Pole. NOAA’s short-term product places the pattern around Earth’s magnetic pole. Read the map’s geometry, lighting and legend before deciding what a colored region means for a Nordic location.
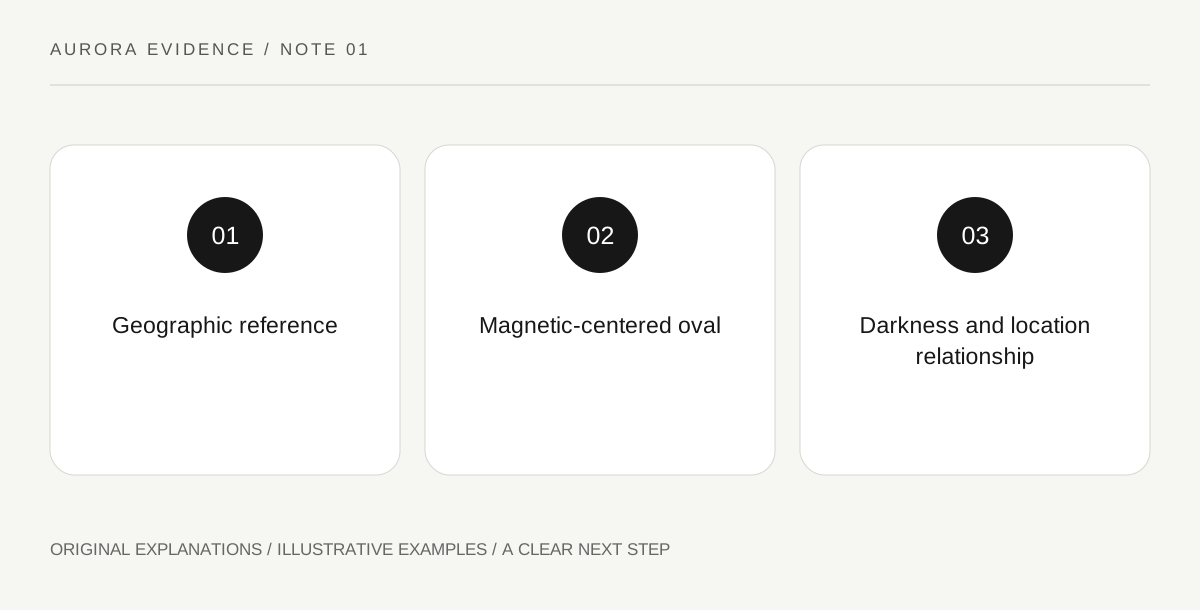
Original explanatory diagram. Read the full method and limitations below.
Identify which pole organizes the pattern
NOAA’s product explanation describes an auroral oval centered on the magnetic pole. Geographic latitude and distance from the geographic pole therefore do not fully describe the map relationship. Locate a known place on the displayed map and identify the actual oval around it. Do not assume that every town at the same geographic latitude occupies the same position relative to the modeled pattern. A simple drawing with two separately labeled reference points can illustrate the distinction without claiming to show an exact current magnetic-pole location. The drawing explains a concept; the official product supplies its actual geography.
Keep the colored band separate from the ground
The oval represents a modeled upper-atmosphere phenomenon, not a ground-level route or a road corridor to travel along. A town drawn under a colored area still needs a dark enough sky and appropriate local observing conditions. Likewise, a sharp-looking map boundary should not be interpreted as a physical wall beyond which light cannot be seen. Read NOAA’s own usage explanation for what the product represents. The useful question is how your location relates to the modeled region, not which exact road reaches the strongest color. A forecast graphic does not assess public access or authorize a journey through remote terrain.
Read daylight shading before comparing two locations
The NOAA display distinguishes the sunlit side of Earth. That shading supplies a different kind of information from auroral intensity. A bright modeled region on the day side is not an outdoor viewing opportunity equivalent to the same color under darkness. Keep these two layers apart in your notes. When comparing places, ask both where the modeled oval lies and whether the sky is dark enough there. Do not let a compelling color scale erase the day-night geometry. If the display is rotated or animated, re-identify the location instead of assuming it stayed in the same position on the screen.
Use an annotated screenshot as a learning record
For a private study note, record the product name, displayed time and the place you are examining, then add short labels for pole reference, oval and daylight. Keep the original legend visible. The note is an interpretation of a particular graphic, not a live forecast after it has been saved. An illustrative classroom version can use an invented oval on a blank globe and explain why two equal-latitude points need not have identical relationships to it. That exercise teaches map reading without presenting a fabricated forecast or encouraging travel based on a colored patch alone.
Illustrative unequal relationship
A teaching globe marks two invented towns at the same geographic latitude and draws an offset magnetic-centered oval. One town lies closer to the band than the other. A separate shaded half marks daylight. The caption says the positions are illustrative and not a forecast. The learner can now explain why latitude, modeled activity and darkness are separate map questions.
Practical checks
Optional checkboxes save only in this browser.
Questions that come up
Do equal geographic latitudes guarantee the same aurora-map position?
No. The modeled oval is organized around the magnetic-pole relationship. Use the actual product geography rather than geographic latitude alone.
Does the brightest map color identify a place I should drive to?
No. The graphic describes a modeled phenomenon, not road conditions, lawful access or travel suitability. Interpret it alongside local information without converting the color field into a route.
References and scope
These sources support the factual background. Examples and exercises are original illustrative teaching material. References do not imply endorsement.
- NOAA: short-term aurora model — OVATION oval, forecast validity, magnetic-pole framing and variable short lead time.