Finland’s R Index: Read the Station and the Ten-Minute Interval
The Finnish Meteorological Institute’s aurora service includes a local magnetic-activity measure that should not be confused with planetary Kp. Its R index concerns the rate of magnetic-field change at a station. The station, time interval and threshold explanation are essential parts of interpreting the coloured display.
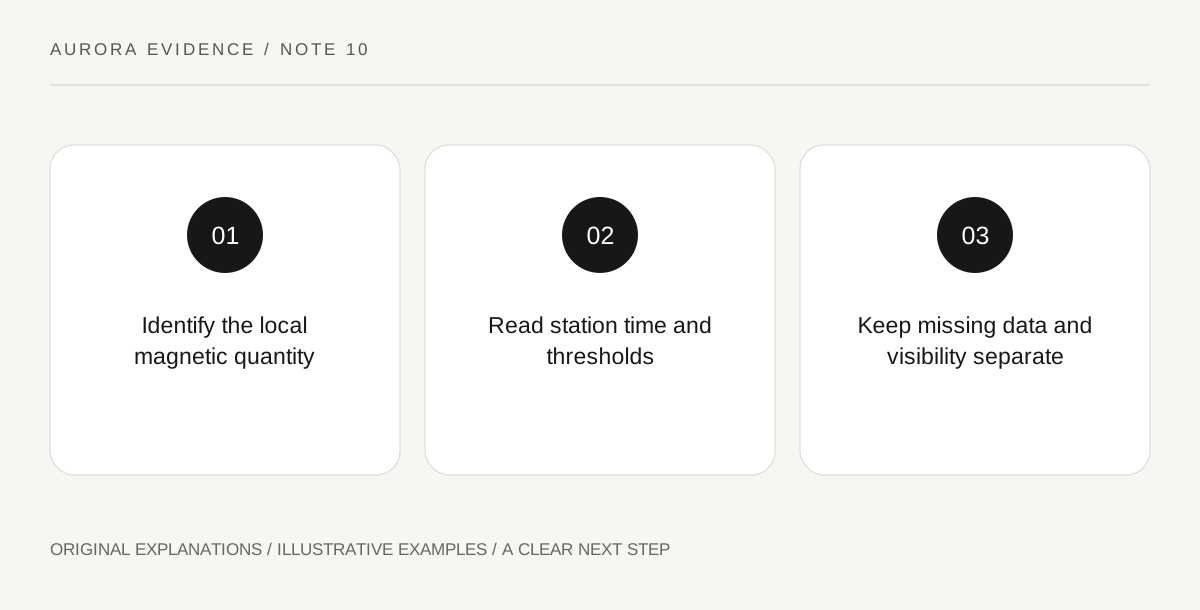
Original explanatory diagram. Read the full method and limitations below.
Read the quantity before its colour
The Finnish Meteorological Institute explains R as a measure based on magnetic-field change over a ten-minute interval. That definition differs from the three-hour planetary Kp index. Even when both products use coloured graphics, their numbers cannot be exchanged as if they were the same scale. Begin with the product’s own explanation rather than a general aurora-app legend. A screenshot labelled only “activity high” loses the measurement being discussed. Keep the quantity name and the interval together in your notes so a later comparison does not quietly merge two different kinds of scientific information.
Station location is part of the result
A local station observation belongs to a particular measuring location. It does not automatically describe the magnetic conditions above every settlement in Finland or the wider Nordic region. FMI’s map provides station-based information, and its explanation associates thresholds with those locations. Select the relevant station and read the corresponding labels. A nearby place may be a useful geographical reference, but proximity alone does not make a station an exact measurement at your accommodation. When comparing stations, retain their names and times rather than copying only the strongest colour from a national map.
Interpret thresholds with their source legend
FMI describes lower and upper activity thresholds displayed through its service. The thresholds support the product’s interpretation of the local magnetic observations. They are not a guarantee that an observer will see a bright display through cloud, daylight or an obstructed view. Read the current legend because interface choices can change. Distinguish a threshold crossing from the length of time activity remains elevated. A brief highlighted interval and repeated highlighted intervals tell different observational stories, even if a cropped screenshot gives both the same colour. Keep a longer view when discussing the development of an event.
Treat missing observations as missing
A service can show that the latest observation is unavailable. That state must remain separate from low measured activity. Do not fill a blank with an assumed quiet value or interpret a missing station marker as proof that nothing happened there. Compare the last available timestamp with the time you are reading the page. If current data are absent, say that the product cannot answer the immediate station question. Other official observations may provide context, but they should be identified separately rather than silently substituted. This distinction is especially important when saving maps for later comparison with personal observations.
Illustrative station comparison
A hypothetical screenshot shows one station with a recent highlighted interval and another without a current observation. The correct caption names the first station and its time, then marks the second as unavailable. It does not rank the second location as quieter. A separate column records whether the intended viewing location has dark, clear sky; the magnetic map cannot supply that local weather observation.
Practical checks
Optional checkboxes save only in this browser.
Questions that come up
Can I convert an R value directly to Kp?
Do not treat the two as interchangeable scores. Their definitions, geographic scope and time intervals differ, so any formal relationship needs its own scientific explanation.
Does a red station marker guarantee visible aurora?
No. It reports information within that magnetic product. Visibility also depends on the atmosphere, darkness, the local view and the evolving display.
References and scope
These sources support the factual background. Examples and exercises are original illustrative teaching material. References do not imply endorsement.
- FMI: auroras and space weather — Local station R-index, ten-minute rate of magnetic-field change, thresholds and missing-data category.
- NOAA: estimated planetary K-index — Estimated three-hour geomagnetic index and distinction from local optical visibility.