A Keogram Is a Day of Slices, Not One Panoramic Photograph
A keogram can compress many hours of sky observations into a rectangular graphic. The Swedish Institute of Space Physics explains its construction using slices from successive all-sky images. Once the axes are understood, the picture becomes a time record rather than a mysterious stretched aurora photograph.
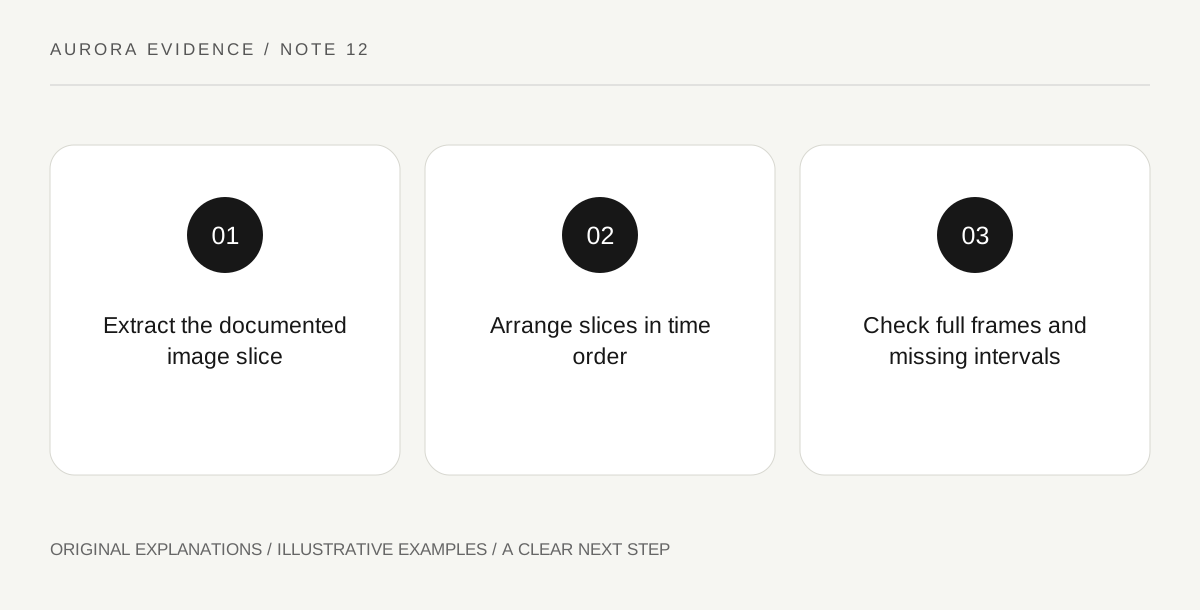
Original explanatory diagram. Read the full method and limitations below.
Build the image in your imagination
The IRF description explains that a central line from successive camera images can be placed alongside the next to create a daily overview. Imagine taking a narrow slice through one image, then another slice at the next observation time, and arranging the slices in order. The result combines time with position along that slice. It is not a photograph that a person could see by looking at the whole sky at one instant. Understanding this construction prevents a common mistake: treating the entire rectangle as a landscape with neighbouring geographic places arranged from left to right.
Read the axes from the relevant documentation
IRF’s technical handbook describes a keogram presentation with time along the horizontal dimension and a poleward-to-equatorward relationship along the vertical dimension. The exact labels and current interface should be checked before interpretation. A historical handbook is useful for the method but should not be treated as proof that every modern viewer has identical controls. Locate the time standard, the date and any orientation labels. If the graphic lacks sufficient labels, avoid assigning exact directions or times from memory. A copied strip without its axes is useful as an illustration only when its limitations are made clear.
Interpret a bright band as a pattern over time
A streak across a keogram indicates how brightness along the sampled slice changed through the observation sequence. The graphic may reveal sustained activity, brief features or interruptions, but it samples only part of each original sky image. A feature outside that slice may be underrepresented or absent. To investigate a particular interval, return to the corresponding full all-sky frames when available. The keogram helps you find a period worth examining; it does not preserve every shape visible in the original dome. Avoid reading a complex curtain’s full structure from a single narrow extracted line.
Keep non-observation intervals visible
Daylight, unavailable images and other limits can affect a daily record. Read the source’s explanation of blank or specially coloured intervals instead of assuming that every pale region means quiet auroral conditions. IRF’s historical documentation discusses how non-nighttime periods appear in its presentation. When making your own teaching diagram, label invented missing data explicitly and avoid borrowing a colour convention without a legend. A useful interpretation states what the graphic records, what interval is being discussed and what evidence is absent. Those qualifications make the graphic easier to compare with observation logs and other instruments.
Illustrative paper keogram
Draw six narrow columns representing six invented observation times. Mark one position on each column where a hypothetical bright feature crossed the sampled line. Put time labels underneath and a direction legend beside the grid. The completed strip shows a sequence, not six neighbouring towns. Leave one column labelled “no image” to demonstrate why a missing measurement cannot be read as a quiet sky.
Practical checks
Optional checkboxes save only in this browser.
Questions that come up
Can a keogram show every auroral feature?
No. Its construction samples a chosen line from successive images. Features elsewhere in the original frames can be missing or only partly represented.
Is an empty strip proof of no aurora?
Not without checking the legend and data availability. It may represent daylight, missing images or another observation limit rather than a measured absence.
References and scope
These sources support the factual background. Examples and exercises are original illustrative teaching material. References do not imply endorsement.
- IRF: all-sky camera and keogram — Central-line slices from minute images form a daily overview; this is a compressed view.
- IRF: camera data handbook — UTC filenames and keogram axes; historical technical description, not a guarantee of current interface.