Upstream Solar Wind: Why an L1 Measurement Is Not an Instant Aurora Signal
A solar-wind graph can change before a viewer on Earth notices anything unusual. NOAA uses upstream spacecraft measurements to monitor conditions approaching the planet. Understanding where those measurements come from makes the graph more useful, while preventing a single dramatic line from becoming a promise of visible aurora.
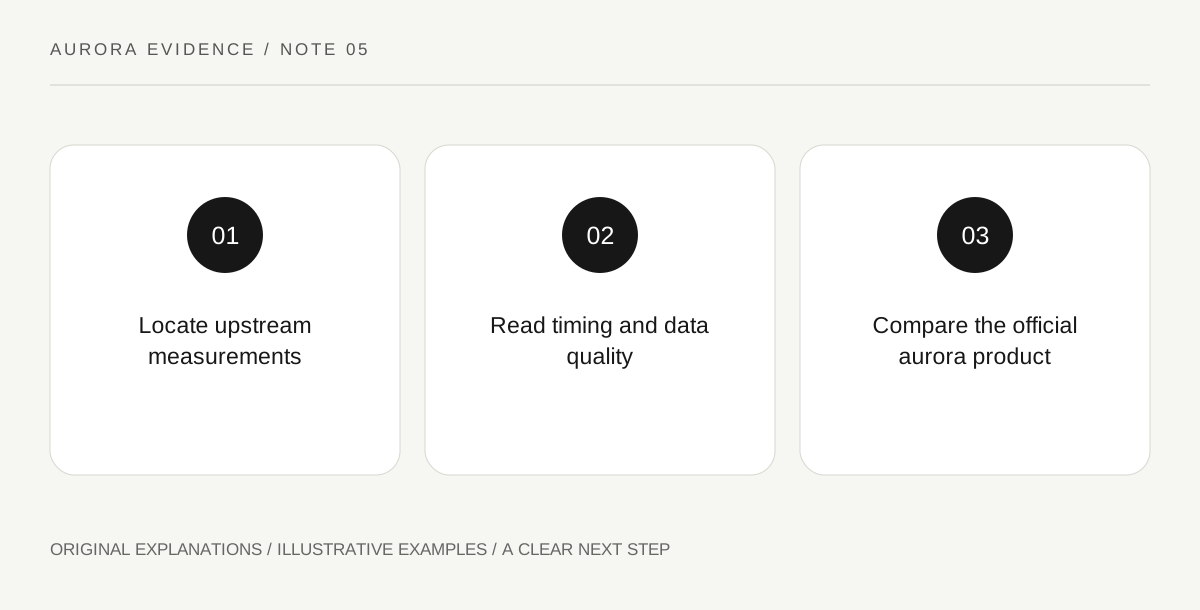
Original explanatory diagram. Read the full method and limitations below.
Locate the measurement before reading the line
NOAA describes its real-time solar-wind product as measurements from spacecraft upstream of Earth near the L1 region. The displayed values concern plasma, magnetic field and related conditions at the observing spacecraft. They are not a direct measurement of the sky above your hotel. This distinction creates useful warning potential, but it also introduces travel time and uncertainty. Read the spacecraft or data-source label when it is available. If the interface switches between available sources, preserve that fact in your notes rather than assuming every point in a long screenshot came from exactly the same instrument.
Treat lead time as a relationship
Material travelling from an upstream measurement location takes time to reach the region where it interacts with Earth. The delay depends on the circumstances, including solar-wind speed, and should not be reduced to one universal countdown copied into a travel article. NOAA gives an approximate short-term forecasting range for its aurora model rather than a guaranteed personal viewing appointment. Use the official product explanation to understand the relevant timing. If you compare two graphs, check whether the timestamps refer to measurements or an adjusted forecast. An apparent offset between curves can be meaningful without implying that either chart is wrong.
Read multiple variables and data quality
A graph can show speed, density and components of the interplanetary magnetic field, among other quantities. These describe different aspects of the incoming environment. A sudden change in one variable is not a complete explanation of a local sky display. Look for missing segments, quality information, averaging choices and the time span selected in the interface. Zooming out or changing averaging can make a short fluctuation look smoother. A data gap means the measurement is unavailable in that interval; it does not mean the solar wind stopped or the geomagnetic environment became quiet.
Connect the graph to the viewing question carefully
For a traveller, the useful question is whether the scientific evidence changes the expectation for an observation period that is already practical. Consult the official aurora product alongside local darkness and cloud information, and keep the scientific interpretation separate from access decisions. Do not turn one magnetic-field value into an instruction to rush onto an unfamiliar road. Conditions can evolve after the upstream measurement, and local visibility still matters. A defensible note describes the observed trend, the source and time, then states what remains unknown about the sky at the intended viewing location.
Illustrative graph review
Imagine a classroom screenshot showing a rise in solar-wind speed followed by a missing segment in the magnetic-field panel. A careful caption records both features. It does not fill the gap with a guessed value or claim an exact aurora start time. The next step is to revisit the live official products and compare their time labels, while retaining the original screenshot as evidence.
Practical checks
Optional checkboxes save only in this browser.
Questions that come up
Is one southward magnetic-field reading enough?
A single reading is incomplete evidence. Duration, other solar-wind conditions, the evolving interaction with Earth and local visibility also affect what can be observed.
Can I use an old graph as a forecast?
Use it as a historical example with its date preserved. A current viewing decision requires current source data and the relevant product explanation.
References and scope
These sources support the factual background. Examples and exercises are original illustrative teaching material. References do not imply endorsement.
- NOAA: short-term aurora model — OVATION oval, forecast validity, magnetic-pole framing and variable short lead time.
- NOAA: solar-wind data — Upstream L1 measurements, variables, data gaps and selectable primary spacecraft.